CXM Direct Joins Trading Central
When an industry leading broker collaborates with a renowned trading analysis provider, the only outcome can be success. CXM Direct joins forces with Trading Central to provide you with top level analysis that will help you build and execute the strategies you want.
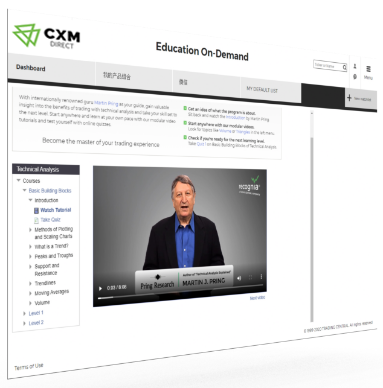
Trading Central Research Platform
Trading Central’s Research platform is available for every CXM Direct client with access to the internet. The web-based application’s mission is to update technical levels, targets and time frames for all assets. Technical analysis and analysts’ views on various trading topics are always just a click away, available through stand-alone portal and directly on CXM Direct’s MT4 platform, keeping you informed every step of the way.
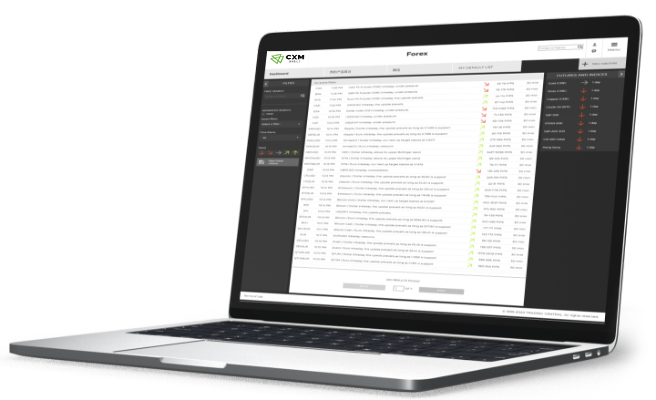
Trading Central, a trader’s best companion
Trading Central analytics can be accessed directly with the CXM MT4 trading platform for qualified clients. Contact your Account Executive to learn more about the eligibility criteria
Still wondering why use Trading Central? The unique versatility and flexibility of Trading Central's solutions makes it simple to deliver the insight you need to succeed such as investment research and technical trading analysis. Trading Central is blazing the path for financial market solutions which successfully combine the invaluable experience of senior analysts with automated algorithms. Trading Central provides financial market technical analysis services to 38 of the top 50 global investment banks, hedge funds, specialized traders and brokers.
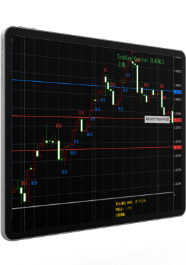
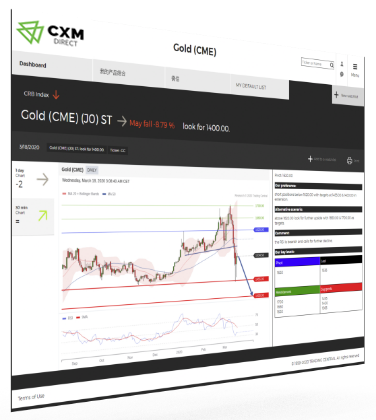
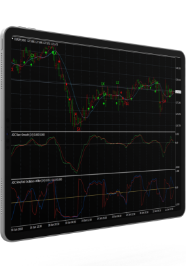
CXM Direct & Trading Central combines candle charts with unique quantification and technical analysis, focusing on related technical graphics that are helpful for investment decisions at the current stage.
The space TC MT4 indicator can scan any chart and find 16 commonly used and selected candle technology graphics when you need them.
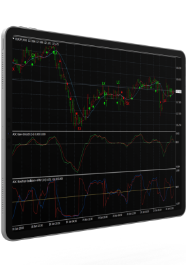
We use a moving average before weighting as a slow indicator. Fast indicators use changing weighted moving averages—trend markets have shorter cycles and longer volatile market cycles. This can be more effective, because other moving averages do trend, and often give a slower signal: observe the trend upwards, the fast indicator is above the slow indicator; or the price passes above the indicator. These are the basic elements of the adaptive divergence indicator (ADC).

For fast signals, observe the upward slope and when the ADC initial signal line is above the ADC smooth signal line, there will be a buy signal. For slow signals, observe that the ADC initial signal line and ADC smooth signal line are above the 0 line at the same time. Like the MACD indicator, the initial signal line represents the difference between the fast and slow indicators. This is the smoothed exponential moving average, but in this case, we find that the smoothed automatic length value is usually around 4, which is different from the value of the MACD indicator which is 9.
Blank labels will help remind you of trading opportunities: (buy long position), LX (long position exit), (short position buy), SX (short position exit). Signals are given based on all adaptive divergence indicators (ADC) components, including price lines, indicators and oscillators. These components can be displayed in an adaptable price data window, they are independent of each other, but we can make decisions by weight.
The space ADC indicator has two oscillation factors. For fast signals, observe that the fast oscillation factor will go up and above the zero line. For slow signals, observe that the fast oscillation factor is above the slow factor, or observe that the slope of the slow oscillation factor is upward and below the fast factor, and is higher than the adaptive variable.

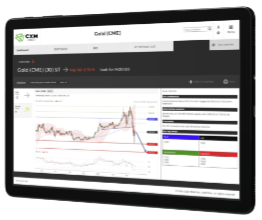
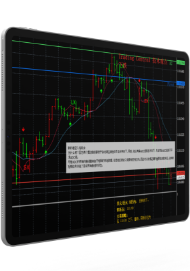
Leave your analysis to the experts, you can directly use the analysis results of CXM Direct & Trading Central to help you trade. You can intuitively understand our trend views and target points. At the same time, you can find alternative strategies. Through our turning point, we will tell you when to change the trend view and give the target price of the alternative strategy


